

Share your story with sweet visuals that captivate your audience. Since 2011, hundreds of forward-thinking brands have picked Lemonly to help them break through the noise and make their messages memorable.
Whether you need some static data viz, an eye-catching animated piece, or an engaging interactive experience, infographics can help tell your unique story. You’ll deliver clear, delightful, and intentional visuals for your audience and highlight your brand with beautiful, bespoke design.
Infographics bring together information and design to tell a story. An infographic is a strategically designed piece of content that uses visuals — illustration, iconography, data visualization, you name it — to make a complex concept, story, or data set easy to understand.
Infographics come in all shapes and sizes, from tall and rectangular to something more bite-sized. They can also be static, animated, or interactive — blending delightful design and clever copy with motion and interactivity to create a uniquely engaging visual experience. Whatever your story is, infographics are a great tool in your content marketing toolbox. Read more about infographics.
Images tell stories better than text alone, using clever visuals and formatting to help audiences grasp content more easily.
People remember visuals better than words. Infographics hold your audience's attention and help them retain information.
Publish your infographic on your website, share across channels, slice up key visuals, and create divisible content to reinforce your message.
Infographics boost dwell time and SEO by creating entertaining, informative content that keeps your audience's attention locked in.
Showcase your personality and thought leadership with visual content that makes the world a little easier for people to understand.
Every pixel highlights your brand's unique story, from visual style to voice, helping audiences connect with your expertise.
When you think of an infographic, you might picture a tall, static image with illustrations, charts, and skimmable text (what we call a classic or static infographic). Static infographics are Lemonly’s bread and butter, and they’re popular storytelling tools for content marketers in nearly every industry. Visuals are super effective for communicating complex information and engaging audiences. Static infographics like these make your message clear and memorable.
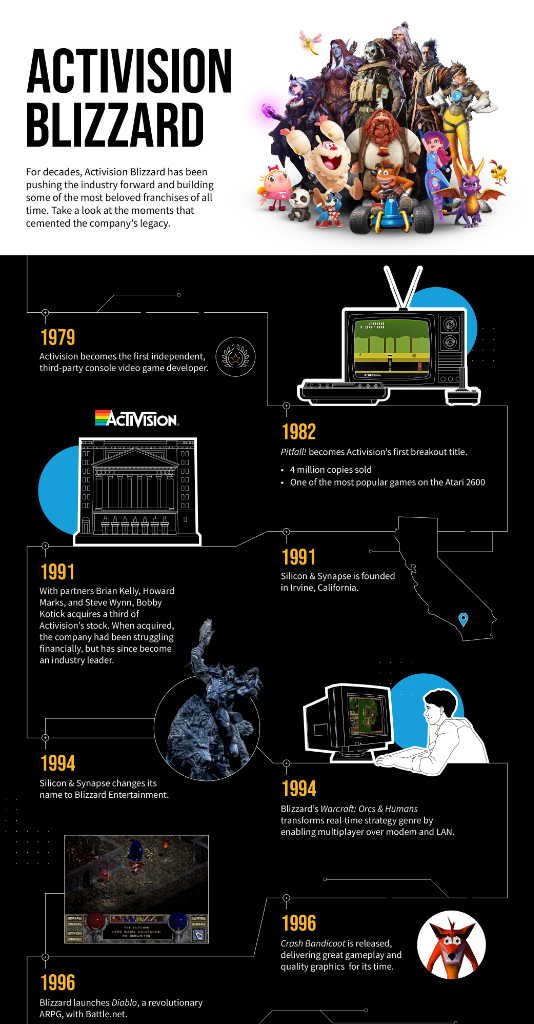
We’ve worked with hundreds of clients across every industry to tell their stories with sweet visuals. Check out some of our work with infographic clients like Activision Blizzard, the Green Bay Packers, and Marriott.
Animated infographics add motion to increase visual interest, clarity, and overall impact. From subtle movement to complex animated scenes, motion graphics make your story feel alive and even more engaging. These animated infographics keep the classic vertical format, but our animation expertise also includes explainer videos, social media microcontent, and immersive 3D visuals.
Animated infographics are all the rage. See why clients like Google, HealthStream, and the Port Royal Sound Foundation have all partnered with Lemonly to bring their stories to life with motion.
See more animated infographics
Interactive infographics turn your information into an experience. Clickable elements, expandable popups, and other interactivity give your audience ways to dive deeper into your content. Create an interactive flowchart or quiz. Tell a more comprehensive story with a complex organizational structure. Offer an immersive 3D experience. From simple interactivity to complex web capabilities, interactive infographics help guide users through information like nothing else.
If building unique web experiences is right up your alley, learn more about our microsite capabilities.
Need some interactive infographic inspiration? Check out some of our work with clients like Marriott, the California Teachers Association, and Oceaneos to see how Lemonly can help you tell your story with interactivity.
Infographics are storytelling superheroes that work well for a wide range of messages. Across thousands of projects we’ve created, most infographics tend to fall into one of a few categories. Check out our most common infographic story types below, but don’t let this list limit your imagination: If you have a story to tell, we can help you visualize it.
Shed light on a problem, suggest a solution, and guide viewers through a visual story that opens conversations and steers participants toward a common, actionable goal.
Infographics are natural history teachers. Illustrations, icons, and photography breathe life into historical happenings, while vertical formats perfectly showcase a timeline progression as users scroll.
Flowcharts are your audience's choose-your-own-adventure guides. From picking contact lens colors to selecting vacation destinations or product tiers, these visual roadmaps make decision-making a breeze.
Intimidated by dense reports? An infographic can be your sidekick, offering an engaging, high-level preview that transforms complex white papers into digestible visual narratives.
When you're Googling "What's the difference between…," cross your fingers for an infographic. Nothing explains concepts more thoroughly than impactful visuals and razor-sharp, concise copy.
Eureka moments deserve celebration! Spread the news, answer FAQs, and announce your latest discovery, invention, or product launch in one sweet, visual package.
Explaining a process without visuals is like rowing a canoe without oars — possible, but painfully slow. Visual step-by-steps help viewers navigate life's complicated journeys with ease and clarity.
Don't let your announcement land with a thud. Impactful visuals transform data into digestible content, give your brand the star treatment, and ensure your news gets the fanfare it deserves.
Turn raw data into visual poetry. Charts, graphs, and diagrams make numerical information glanceable, memorable, and far more understandable than text alone — creativity is your secret weapon.
Want to get more mileage from your marketing efforts? Use divisible content to make your larger pieces of pillar content go further. You’ll reach more of your audience with more content in more places. It’s all about working smarter, not harder.
Divisible content is content that can be repurposed into multiple, often smaller, pieces in different formats for sharing across a variety of mediums or channels.
There are two main ways we approach divisible content: a larger piece of pillar content can be broken up into smaller, bite-sized pieces or converted into different formats. Your goal is to build a web of interconnected content that reaches your audience, reinforces your message, and repurposes design assets.
Here are a few examples of what divisible content can look like:
Creating divisible content is all about making your efforts and resources go further. Some of the top barriers that keep marketers from making (more) great content are time, team, and cost. Divisible content addresses all three — helping you leverage your existing content and tentpole pieces to create a web of interconnected pieces that all work together to drive your message home.
Let’s run down a few of the benefits of divisible content:
Making a web of divisible content not only gives you more content to use in more and different places — it also lets you do so with minimal extra effort. You’ve already invested the time, energy, and resources to create a great piece(s) of pillar content, so why not increase your return on that investment?
Great question. Whether you’re starting from scratch or repurposing existing pillar content, there are four steps to start building out your web of divisible content:
Microcontent is what we call small graphics with a concise message, perfect for posting on social media and driving traffic back to your pillar content. These bite-sized visuals can be static or animated and are built to share — including social media posts and stories, link preview images, email and blog graphics, and more. If you’re looking for a way to lead your audience to larger pieces of content, microcontent makes a great teaser and promotion tool.
Check out some of our microcontent work for clients like Marriott, the GRAMMYs, and Lemonly’s own data visualization series.
Want to learn a thing or two about how you can use an infographic to create divisible content? Well, here are 70 ways to do just that. Check out the blog to see some of our favorite ways to slice and dice an infographic to get the most out of your project.
Read more


Lemonly is a unique creative agency that makes sweet visual content with clever copy and delightful design — infographics, explainer videos, microsites, branding, and more. Our infographic-style approach to visual storytelling and our proven “lemons-to-lemonade” process ensure everything we create has clarity at the core. We turn boring to brilliant, complex to concise, and abstract to actionable with the power of visuals.
With over 14 years of experience and hundreds of clients across nearly every industry, our team of expert content writers, designers, animators, and account service pros is ready to help tell your story.


We’ve honed our data-to-design process over thousands of visual content projects, ensuring a smooth experience every time. Our infographic process turns your raw ingredients into visual content that’s easy to understand and enjoyable to consume — sweet, never sour, just like a refreshing glass of lemonade.
Wanna know more about infographics? Get answers to some frequently asked questions here.
Content marketing is all about creating and distributing valuable, relevant, and consistent content to attract and retain a target audience and drive customer action. Infographics do exactly that — explaining information clearly with visuals that engage and entertain readers.
Infographics and other visual content make things easier to understand, which means more clarity and less confusion. While content marketing outcomes like education, affinity, and intent can sometimes be tricky to measure, the cost of confusion is crystal clear: slow sales, lost leads, fewer repeat customers, and more disengaged employees.
Infographics give you clear, valuable content that helps build a loyal audience and avoid costly confusion.
Read more about the cost of confusion and the value of visual content.
Infographics make information easier to understand, so they’re great for explaining concepts, products and services, processes, you name it. Companies use infographics to educate and entertain customers, generate leads, answer FAQs, promote their offerings, build thought leadership, and more.
In general, infographics can be either branded or editorial:
Check out our work portfolio and case studies for more examples of how companies use infographics and other sweet visual content.
Infographics are valuable and highly versatile content marketing assets, but that doesn’t mean they’re the right choice for every brand every time.
Here are a few questions that can help you gauge whether an infographic is a great fit for your goals:
Read more about how to know if you need an infographic.
The best infographics have a few key things in common:
When you work with Lemonly, we make sure these components are part of every infographic we create. Read more about what the best infographics have in common.
Infographics live on the web, and they’re built to share. But it’s not as simple as posting your full infographic on social media (trust us, that’s not a good idea).
The ideal infographic publishing scenario looks something like this:
We have more tips on how to publish your infographic and avoid any no-nos that’ll hurt your infographic’s chances of success. Read more about best practices for publishing your infographic online.
When it comes to promoting your infographic, it’s all about divisible content. Microcontent — small, easy-to-share graphics — are the perfect way to share your infographic on social media. A bit of microcontent makes the link card beautiful and enticing, while keeping your full infographic on your website where it looks its best. You share, they click, and they keep browsing your site once they’re there.
Dig into more social media best practices for sharing infographics.

The best infographics have a few ingredients in common, from a clear main idea to beautiful yet functional design. Learn what makes infographics great.
Read more
Infographics come in all shapes and sizes. What’s the right fit for your project? Check out our advice for choosing the right format for your infographic.
Read more
Your brand-spankin’-new infographic deserves the chance to shine. Read our guide to pixel-perfect infographic publishing for the best results.
Read more